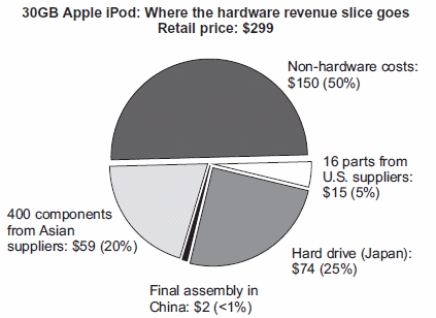
The diagram indicates the revenue distribution of a $299 30GB Apple iPod.Most of the "non-hardware costs" are product development (e.g. ,software and R&D) ,but also includes advertising and retail costs.If the key industry argument has merit,what does this diagram suggest about which industries are actually key? 
Definitions:
Shortage
A market condition where the demand for a product exceeds the supply at a given price, often leading to higher prices.
Surplus
A situation where the quantity of a good or service supplied exceeds the quantity demanded at the current price.
Equilibrium Quantity
The quantity of goods or services that is supplied and demanded at the equilibrium price, where the quantity supplied equals the quantity demanded.
Equilibrium Price
The market price at which the supply of an item matches its demand, leading to a stable market where there is no surplus or shortage.
Q3: Which of the following statements is TRUE?
Q5: The main reason that government legislation on
Q32: Roses grown in Kenya travel to Amsterdam
Q34: A higher opportunity cost of producing a
Q47: When the price of a good increases,demand
Q50: If policies like sugar quotas and tariffs
Q103: Brazilian rosewood is renowned for its tonal
Q122: Utilizing comparative advantage can best be exemplified
Q133: The greater the share of the population
Q136: If,at a world price of $200,domestic consumers