Use the following to answer question 92:
Figure: The Optimal Quantity of Pollution 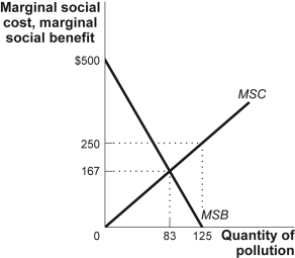
-(Figure: The Optimal Quantity of Pollution) Use Figure: The Optimal Quantity of Pollution.The figure shows the marginal social cost (MSC) and marginal social benefit (MSB) for firms that pollute the air with sulphur dioxide.Using the figure,the optimal Pigouvian tax per unit of pollution is:
Definitions:
Q14: Consider the time allocation budget line for
Q18: In monopolistic competition,the primary source of product
Q23: Miss Marple spends her entire leisure time
Q130: In April 2017,the difference in earnings between
Q170: (Table: Value of the Marginal Product of
Q184: Industries that are made up of many
Q204: Capital,the factor of production,includes physical capital (such
Q226: (Table: Demand for Crude Oil)Use Table: Demand
Q291: (Figure: The Demand for Bricklayers)Use Figure: The
Q302: In terms of labour supply,the substitution effect