Use the following to answer question:
Figure: The Socially Optimal Quantity of Pollution 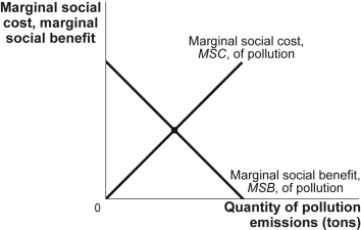
-(Figure: The Socially Optimal Quantity of Pollution) Use Figure: The Socially Optimal Quantity of Pollution.In the figure,firms are the only beneficiaries of pollution,and costs are borne solely by others in the society.The optimal quantity of pollution could be achieved:
Definitions:
Q45: (Figure: Pricing Strategy in Cable TV Market
Q52: Means-tested programs are available only to those
Q53: When a monopolistically competitive firm is making
Q54: When a welfare program is provided to
Q93: Lakisha's labour supply curve is downward sloping
Q127: (Figure: The Market for Gas Stations)Use Figure:
Q186: Wage differentials that arise because of innate
Q198: (Table: Demand Schedule of Gadgets)Use Table: Demand
Q223: Monopolistic competitors:<br>A) have some ability to set
Q237: Excess capacity is a problem in monopolistic