Use the following to answer questions :
Figure: Payoff Matrix for Gehrig and Gabriel 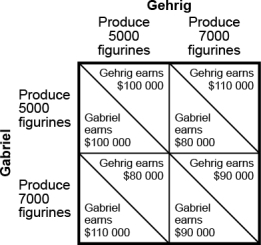
-(Figure: Payoff Matrix for Gehrig and Gabriel) Use Figure: Payoff Matrix for Gehrig and Gabriel.The figure describes two people who sell handmade Carey Price figurines in Montreal.Both Gehrig and Gabriel have two strategies available to them: to produce 5 000 figurines each month or to produce 7 000 figurines each month.For both Gehrig and Gabriel,the dominant strategy is to:
Definitions:
Classes
Categories or groups into which data or objects are organized based on shared characteristics or attributes.
Histograms
A graphical representation that organizes a group of data points into user-specified ranges.
Leaf
In the context of a tree data structure, a leaf is a node that has no children.
Stem
In the context of data visualization, the stem represents the main part of a stem-and-leaf plot, displaying digits for significant value while the leaf displays less significant digits.
Q5: In the long run,monopolistic competitors will:<br>A) earn
Q36: (Figure: Firms in Monopolistic Competition)Use Figure: Firms
Q93: A monopoly's short-run supply curve is its
Q117: Which statement about the differences between monopoly
Q120: In the 1960s and 1970s,General Motors often
Q131: Because monopolistically competitive firms charge a price
Q199: Suppose there are 10 identical firms in
Q221: Suppose a perfectly competitive market is suddenly
Q284: (Figure: PPV)Use Figure: PPV.The figure shows the
Q316: The demand curve for a monopoly is:<br>A)