Use the following to answer question:
Figure: Monopoly Profits in Duopoly 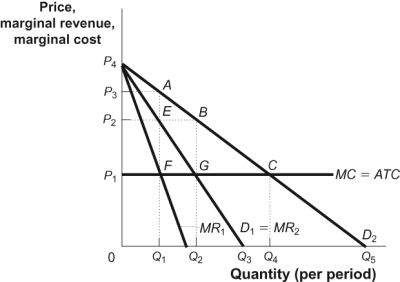
-(Figure: Monopoly Profits in Duopoly) Use Figure: Monopoly Profits in Duopoly.The figure shows how an industry consisting of two firms that face identical demand curves (D1) can collude to increase profits.If the firms collude to share the market demand equally,then each firm will act as if its marginal revenue curve is given by:
Definitions:
Accrued Revenue
Revenue earned but not yet received in cash or recorded at the statement date, typically recognized in accrual-basis accounting.
Accrued Expense
Expenses that have been incurred but not yet paid or recorded at the end of a reporting period.
Payback Periods
The duration of time it takes to recover the cost of an investment through the investment's cash flows.
Q7: (Figure: Payoff Matrix for Gehrig and Gabriel)Use
Q21: (Figure: Short-Run Monopoly)Use Figure: Short-Run Monopoly.The marginal
Q23: A familiar example of a negative externality
Q81: (Figure: Profit Maximization in Monopolistic Competition)Use Figure:
Q103: In oligopoly,a firm must realize that:<br>A) what
Q142: (Table: Coal Mine Pollution)Use Table: Coal Mine
Q148: When innovations by one firm are quickly
Q217: A well-known example of an international cartel
Q245: (Table: Spring Water)Use Table: Spring Water.The table
Q255: (Table: Demand Schedule of Gadgets)Use Table: Demand