Use the following to answer questions :
Figure: Harold's Indifference Curves
The figure shows three of Harold's indifference curves for bread and cheese. 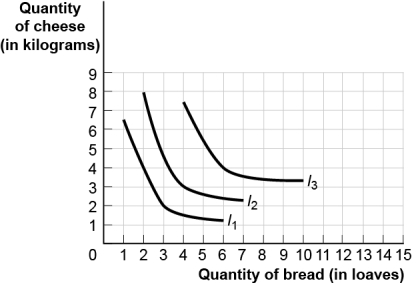
-(Figure: Harold's Indifference Curves) Use Figure Harold's Indifference Curves.Given that the price of bread is $1 per loaf and the price of cheese is $2 per kilogram,as Harold's income increases from $10 to $14,we can determine that bread is a(n) _____ good and cheese is a(n) _____ good.
Definitions:
Q2: On a sparsely populated island,an additional minute
Q4: In economic analysis,the principle of marginal analysis
Q14: (Figure: Kristin's Budget Line)Use Figure Kristin's Budget
Q25: (Table: Cakes)Use Table: Cakes.Pat is opening a
Q41: (Table: Cost Data)Use Table: Cost Data.The average
Q58: (Figure: The Optimal Consumption Bundle)Use Figure The
Q96: (Figure: Budget Lines for Oranges and Apples)Use
Q122: Increases in the price of the good
Q124: Utility is MOST closely related to:<br>A) usefulness.<br>B)
Q173: Wolfgang really likes both rutabagas and broccoli.The