Use the following to answer questions :
Figure: Harold's Indifference Curves
The figure shows three of Harold's indifference curves for bread and cheese. 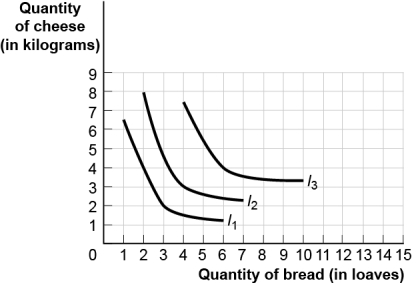
-(Figure: Harold's Indifference Curves) Use Figure Harold's Indifference Curves.If the price of bread is $2 per loaf,the price of cheese is $4 per kilogram,and Harold has $28 to spend on bread and cheese,Harold's optimal consumption bundle is _____ loaves of bread and _____ kilograms of cheese.
Definitions:
Interaction
In statistics, the effect of two or more variables is not simply additive, meaning their combined effect is different from what would be expected based on their separate effects.
Step-aerobics
A form of aerobic exercise involving stepping up and down on a stationary block in different patterns and intensities.
Test Statistic
A calculated value from sample data used to test a hypothesis in statistical testing, determining whether to reject the null hypothesis.
μ
The symbol commonly used to represent the mean or average of a population in statistics.
Q3: (Figure and Table: Variable,Fixed,and Total Costs)Use Figure
Q3: (Figure: Consumer Equilibrium IV)Use Figure Consumer Equilibrium
Q15: If Canada can produce 30 computers for
Q40: (Figure: Short-Run Costs)Use Figure: Short-Run Costs.The vertical
Q57: Suppose the marginal cost curve in the
Q124: (Figure: The Market for Roses)Use Figure: The
Q174: John consumes pizza and pasta,both normal goods.He
Q198: The absolute value of the slope of
Q228: (Figure: Long-Run and Short-Run Average Cost Curves)Use
Q354: If output increases,a firm will move along