Use the following to answer question 26: Figure: Monthly Demand for Ice Cream Cones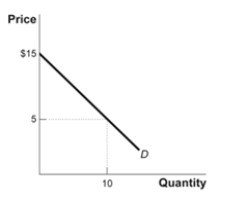
-(Figure: Monthly Demand for Ice Cream Cones) The graph Monthly Demand for Ice Cream Cones shows one individual's linear monthly demand for ice cream cones.At $5 per cone,this individual will consume 10 cones in a month.How much consumer surplus does this consumer receive?
Definitions:
Q19: Prices above equilibrium on agricultural products like
Q79: If demand is perfectly inelastic,changes in price
Q89: A technological advance in the production of
Q132: (Figure: The Gasoline Market)Use Figure: The Gasoline
Q137: (Figure: The Market for Lattes)Use Figure: The
Q197: A tax of $15 on an income
Q226: Overall,the taxes collected by the federal government
Q233: A tax of $10 on an income
Q251: Excess supply occurs when the:<br>A) price is
Q263: Consider the supply curve for cotton shirts.An