Use the following to answer questions:
Figure: Shifts in Demand and Supply IV 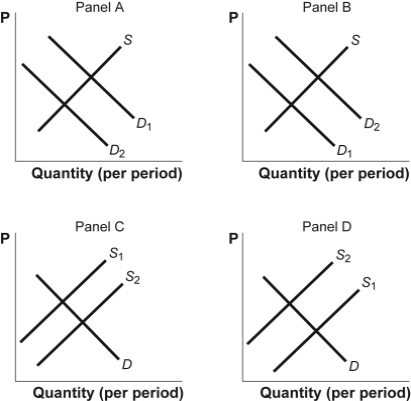
-(Figure: Shifts in Demand and Supply IV) Use Figure: Shifts in Demand and Supply IV.The figure shows how supply and demand might shift in response to specific events.Suppose half of the people in Vancouver pack up and move to Calgary.Which panel BEST describes how this will affect the supply of houses in Vancouver?
Definitions:
Q18: (Figure: Producer Surplus)Look at the figure Producer
Q24: (Figure: Demand and Supply of Gasoline)Use Figure:
Q24: (Table: Price,Quantity Demanded,and Quantity Supplied)Use Table: Price,Quantity
Q34: Producer surplus is represented by the area
Q141: (Figure: The Shrimp Market)Use Figure: The Shrimp
Q172: (Figure: Shifts in Demand and Supply)Use Figure:
Q190: (Figure: Wine and Wheat)Use Figure: Wine and
Q196: It is certain that the equilibrium quantity
Q209: (Table: Willingness to Pay for Basketball Sneakers)The
Q231: (Table: Coffee and Salmon Production Possibilities II)Use