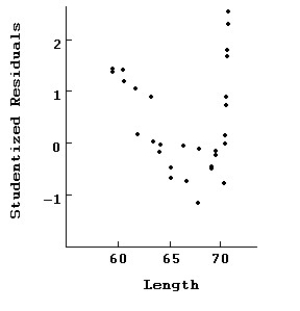
Here are plots of data for Studentized residuals against Length.  Here is the same regression with all of the points at 70 removed.
Dependent variable is: Weight
30 total bears of which 10 are missing
R-squared = 97.8% R-squared (adjusted)= 97.3%
s = 2.96 with 20 - 4 = 16 degrees of freedom Compare the regression with the previous one.In particular,which model is likely to make the best prediction of weight? Which seems to fit the data better?
Definitions:
Personal Liability
The legal responsibility of an individual to settle debts or obligations from their own assets, rather than those protected by a corporation or limited liability entity.
Business Debts
Obligations that a business incurs as a result of operating activities, including loans, accounts payable, and any other form of borrowed money.
No Personal Liability
A legal principle that protects individual actors within a corporation or legal entity from bearing personal financial responsibility for the entity's liabilities.
Agency Relationships
A legal arrangement where one party, the agent, acts on behalf of another party, the principal, in transactions with third parties.
Q2: A person who commutes to work
Q20: A researcher performed a study to
Q21: A firm that focuses on image and
Q26: Suppliers who provide a differentiated product may
Q37: At a high school debate tournament,half
Q41: Suppose that you perform a two-proportion z-test
Q41: If the environmental analysis is too narrow
Q47: The percentage of a firm's profitability that
Q69: A researcher wants to determine if
Q104: A researcher wants to estimate the mean