The scatterplot below displays the total home attendance (in millions) for major league baseball's National League for the years 1960 through 2002.This total home attendance is the grand total of all attendees at all National League games during the season.For what range of years is a linear model appropriate? 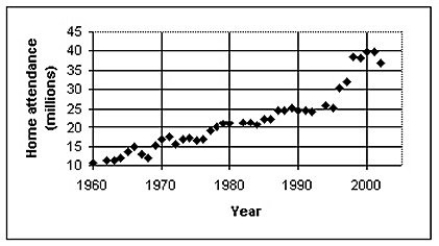
Definitions:
Neurocognitive Disorders
A category of mental health disorders that primarily affect cognitive abilities, including memory, attention, and problem-solving skills.
Nutritional Deficiency
A state in which a person's nutrient intake consistently falls below the necessary level, leading to health problems.
Neuroleptics
Antipsychotic medication.
Q1: A science instructor assigns a group of
Q4: During student-teacher negotiations at a certain high
Q22: <span class="ql-formula" data-value="\begin{array}{c|c|c|c|c|l}\overline{\mathrm{x}} & \mathrm{s}_{\mathrm{x}} & \overline{\mathrm{y}}
Q35: Roll two fair 6-sided dice; record the
Q37: Here is a histogram of the assets
Q40: The boxplots display case prices (in dollars)of
Q43: Match each class with the corresponding boxplot
Q45: Consider a game that consists of dealing
Q60: Consider a game that consists of dealing
Q111: The weekly salaries,in dollars,of 16 government workers