The data in the table below can be used to explore the association between the rate of television ownership and per capita gross domestic product for several countries. a)Make a scatterplot showing the trend in television ownership versus per capita GDP.Describe what you see. 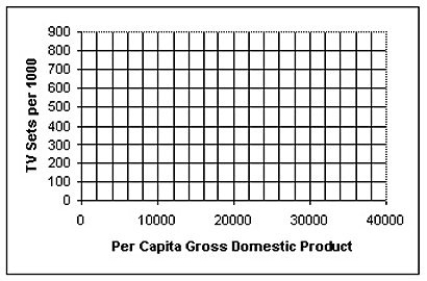 b)Determine the correlation and comment on its significance.
c)Find the equation of the line of regression.Interpret the slope of the equation.
d)Use your model to predict the rate of TV ownership for India,which has a per capita GDP of $2,200.How much confidence do you have in this prediction? Explain.
e)Discuss the impact that the U.S.A.data exerts on the model.
Definitions:
Legal Maximum
The highest limit set by law for rates, prices, or fees. In various contexts, it may cap interest rates, rent increases, or other charges.
Procedural Unconscionability
Unconscionability that derives from the process of making a contract.
Excessive Legalese
The use of overly complex and technical legal language that can be confusing and hard to understand for non-experts.
Blue Laws
Laws that restrict or ban certain activities on Sundays, historically to encourage observance of the Sabbath.
Q6: You draw a card at random from
Q23: In a small town,a certain type of
Q26: Which of the labeled points below will
Q29: A new type of pain reliever is
Q43: The paired data below consist of
Q55: The weekly salaries (in dollars)of 24
Q58: A group of volunteers for a
Q59: Oranges: circumference (centimetres),oranges: weight (grams)<br>A)Negative,nonlinear,moderate<br>B)Negative,linear,moderate<br>C)Positive,linear,moderate<br>D)Positive,nonlinear,moderate<br>E)Positive,no form,strong
Q64: Here are some summary statistics for
Q77: Sunita's job is to provide technical support