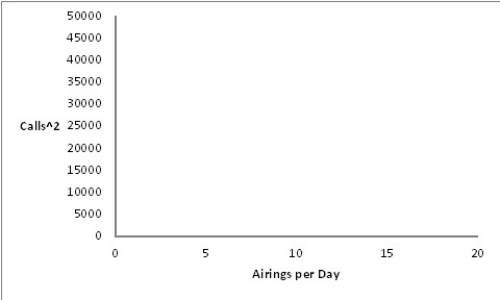
A university radio station has been airing a public service announcement (PSA)that gives a telephone number students can call to get information on upcoming campus events.In order to determine the optimal number of times per day to run the PSA,the station has been counting the number of calls generated each day as a function of the number of times the PSA was aired.The results of the experiment are summarized in the table below. Re-express the data by squaring the number of calls per day,then plot the re-expressed data as a scatterplot. 
Definitions:
Financial Reporting Periods
are the specific time frames covered by financial reports, often annually or quarterly, over which an organization reports its financial performance and position.
Early Adoption
Early adoption refers to the implementation of new accounting standards or regulations before the mandatory effective date prescribed by the regulatory bodies.
Reportable Segments
Operating segments for which an entity reports separate information.
Quantitative Threshold
A predefined numeric limit used to measure the significance or materiality of data, often used to decide when an action is required.
Q3: An education researcher randomly selects 38 schools
Q6: Criticize the following simulation: A student uses
Q7: The plastic arrow on a spinner
Q30: Researchers reported that for men,being unmarried increases
Q36: Do men and women run a 5-kilometre
Q38: Two different tests are designed to
Q44: Litres remaining in a tank of gas,kilometres
Q60: Consider a game that consists of dealing
Q62: Last weekend police ticketed 18 men whose
Q67: Which of the following is not related