Shown below are the boxplot and the histogram for the highest temperatures ever recorded (in °F) in 32 different states in the U.S.A. 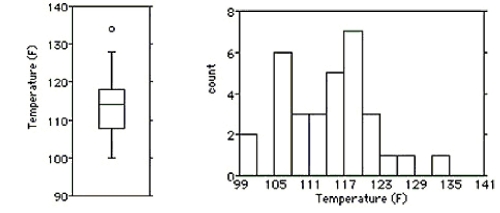
i) What features of the distribution can you see in both the histogram and the boxplot?
ii) What features of the distribution can you see in the histogram that you could not see in the boxplot?
Definitions:
Q8: A survey of automobiles parked in
Q13: Suppose that there are two candidates for
Q16: In her dream, Cindy met _, a
Q19: What is the minimum number of times
Q29: As research for a science class,seventh graders
Q33: A person's political affiliation<br>A)Categorical<br>B)Quantitative
Q35: A college examined the impact of
Q39: The relationship between two quantities X and
Q65: On a recent English exam,scores averaged 84
Q109: Which of the following is good advice