A prediction of the number of medals to be won by various countries in the 2014 Winter Olympics was made using past Olympics data.The predicted values are listed in the table below. Which of the following displays is the most appropriate for these data?
I 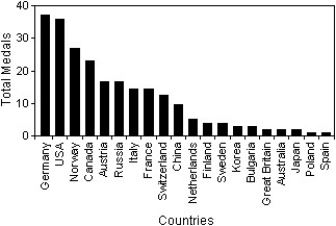
II 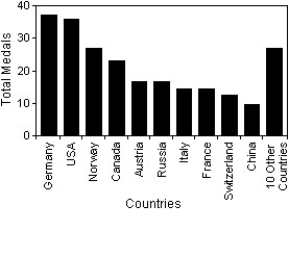
III 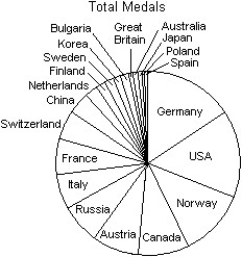
Definitions:
Q3: The following stem-and-leaf display shows the
Q4: A biologist studying hatchery fish released into
Q6: In a PERT network, the critical path
Q8: A golf ball is dropped from
Q23: <img src="https://d2lvgg3v3hfg70.cloudfront.net/TB3450/.jpg" alt=" A)Negative association,linear association
Q31: Here are the test scores of 32
Q35: Here are boxplots of the points scored
Q58: The relationship between the number of
Q67: Owners of a new appliances store tracked
Q96: A cultural attitude that can be an