The following table gives the average number of voters in each of three political parties during the last 12 years, along with the average number that voted in presidential elections during this period. Use these data to find the probability, rounded to two decimal places, that a person selected at random from the registered Democratic voters will vote in the next election. 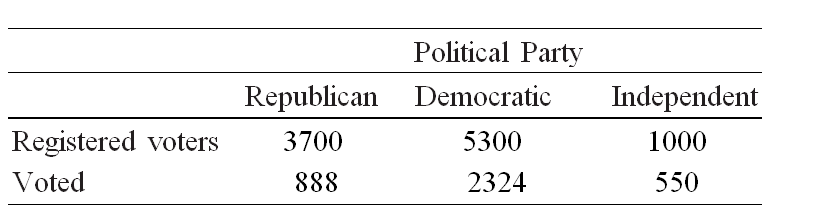
Definitions:
Labor Hours
The total hours of work provided by employees or workers within a specific timeframe.
Marginal Rate
The rate of change of a variable as another variable changes, typically used in the context of taxes, substitution, or transformation rates.
Technical Substitution
The process of replacing one technique or technology with another that is more efficient or cost-effective.
Marginal Products
The additional output produced as a result of adding one more unit of a specific input, while holding other inputs constant.
Q2: In a binomial experiment, find the probability
Q3: When comparing the nursing process with the
Q8: Write the dual maximization problem. <br>Minimize <img
Q24: Write the equation in exponential form.
Q26: The table below gives the votes in
Q41: Six men and four women are semifinalists
Q41: Suppose a pair of dice is thrown
Q66: Suppose that 8% of the patients who
Q74: If a die is rolled 39 times,
Q103: The Wellbuilt Company produces two types of