Multiple Choice
A graph of the force on an object as a function of its position is shown in the figure. Determine the amount of work done by this force on an object that moves from x = 1.0 m to x = 6.0 m. (Assume an accuracy of 2 significant figures for the numbers on the graph.) 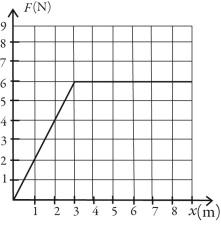
Definitions:
Related Questions
Q2: In the figure, a 60-cm length of
Q4: The figure shows two wires that are
Q17: A 1.20-kg ball is hanging from the
Q24: A wooden raft has a mass of
Q44: A 2.00-kg object traveling east at 20.0
Q47: A rock is thrown directly upward from
Q55: A carousel that is 5.00 m in
Q60: (a) Internal human body temperature is often
Q97: Vectors <img src="https://d2lvgg3v3hfg70.cloudfront.net/TB2997/.jpg" alt="Vectors and
Q98: Suppose that Peggy once became ill after