Use the following to answer questions
Scenario I
Scenario I is based on and presents data from the following study (reproduced from p.25 of the textbook) :
Piff,P.K. ,Stancato,D.M. ,Côté,S. ,Mendoza-Denton,R. ,& Keltner,D.(2012) .Higher social class predicts increased unethical behavior.PNAS Proceedings of the National Academy of Sciences of the United States of America,109(11) ,4086-4091.doi:10.1073/pnas.1118373109
Piff and colleagues (2012) used naturalistic observation techniques to determine if wealthy people behaved more or less ethically than people who were not wealthy.In one study,observers stood at a busy intersection and recorded the make,model,and year of each approaching car.They also noted if the car cut off other cars or pedestrians at this intersection.
Major findings of Piff et al.(2012) are presented in Figure 1.1.This figure shows the percentage of times vehicles cut off another driver (top panel) or pedestrians (lower panel) as a function of the social status of the vehicles (with more expensive cars ranked higher in social status) .
Figure 1.1 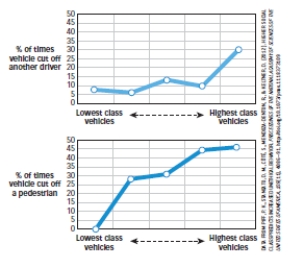
-(Scenario I) Consider only the top panel in Figure 1.1.These results underscore the importance of:
Definitions:
Q15: Helmholtz was a _ who studied _.<br>A)philosopher;the
Q21: Which approach to psychology links psychological processes
Q40: Some early philosophers believed that certain kinds
Q74: Structuralists,such as Wilhelm Wundt,denied the importance of
Q74: Research participants are asked to rotate a
Q76: Physiological psychology was the forerunner of behavioral
Q180: Which characteristic describes a normal distribution?<br>A)It is
Q254: Which statement about critical thinking is TRUE?<br>A)Humans
Q258: Which measure lacks both reliability and validity?<br>A)scholastic
Q287: After training rats to successfully navigate a