Multiple Choice
The graph below shows a plot of angular acceleration in rad/s2 versus time from t = 0 s to t = 8 s.The change in angular velocity, ,during this 8-second period is 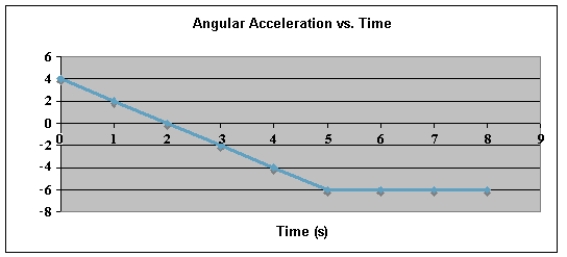
Definitions:
Related Questions
Q12: Two thermometers are calibrated,one in degrees Celsius
Q18: Which of the following combinations of
Q24: A 5.0-g particle moving 60 m/s
Q27: Two ropes are spliced together as shown.
Q30: A piano string of density 0.005 0
Q39: In an adiabatic free expansion<br>A)no heat is
Q43: If n moles of an ideal
Q62: Negative work can be done<br>A)by friction on
Q93: A puck on a frictionless air hockey
Q109: A horizontal disk with a radius of