Below is the three-year bond real interest rate from 2000-2012. Explain why the real interest rate is positive for most of the 2000s and what explains it being negative in 2008-2009 and 2011-2012.
Figure 8.2: Three-Year Bond Real Interest Rate: 2000-2012 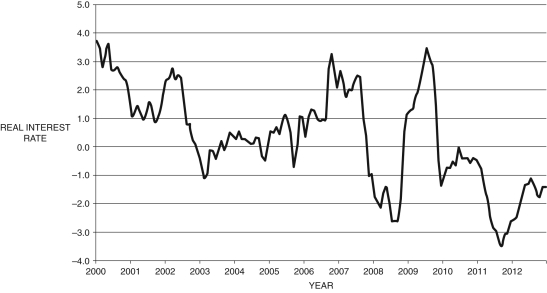
(Source: Federal Reserve Economic Data, St. Louis Federal Reserve)
Definitions:
Q22: When current output rises above potential output,
Q36: A key assumption of the short-run model
Q43: Briefly discuss the macroeconomic outcomes of the
Q59: Consider Table 7.1. In January 2012, the
Q60: From a low of _ percent in
Q77: Between May 2004 and May 2006, the
Q77: Unemployment due to institutional frictions is called
Q79: For any given saving rate, depreciation rate,
Q100: Consider the following Romer model of
Q105: Suppose you are given the data for