Refer to the following figure when answering the next five questions.
Figure 9.2: U.S. Output Fluctuations 1960-2012 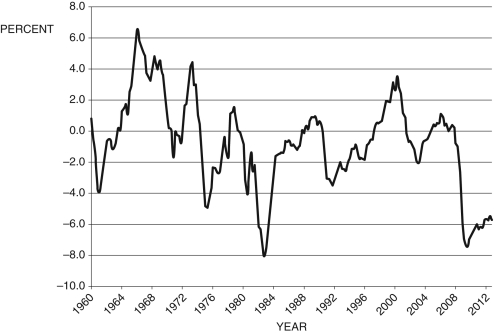
(Source: BEA and CBO, data from Federal Reserve Economic Data, St. Louis Federal Reserve)
-Consider Figure 9.2. The line represents short-run fluctuations, . Since 1960, the largest boom was in about ________ and the deepest recession was in about ________.
Definitions:
Loanable Funds
A term in economics referring to the market where savers supply funds for loans to borrowers, influenced by interest rates.
Induces
Induces means to lead or move someone to take action, often by persuasion or influence.
National Saving
The total amount of savings in a country, equal to the sum of private and public savings, representing the portion of national income not used for consumption or government spending.
Consumption
Consumption involves the use of goods and services by households, constituting one of the main components of aggregate demand in an economy.
Q2: If the current rate of inflation
Q18: One of the remarkable things about the
Q27: In the short run, if the Federal
Q35: The signals of the TV show Dexter
Q63: If the civilian noninstitutionalized population is 230,108,
Q65: In the long run, <span
Q73: Sometimes when discussing inflation, we use a
Q95: If we include population growth in the
Q99: Conventional wisdom is that most of the
Q116: In the corn farm example, corn can