Refer to the following figure when answering
Figure 9.4: U.S. Inflation 1990-2012 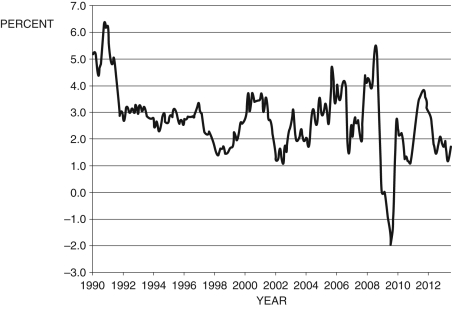
(Source: Bureau of Labor Statistics)
-Consider Figure 9.4, which shows the annual inflation rate. According to the Phillips curve, the period from about 2009 to 2010 was a period of:
Definitions:
Constant Cash Outflow
A fixed amount of money paid out by a company at regular intervals, typically for operating expenses or loan repayments.
Fixed Cost
Fixed costs are business expenses that do not change with the level of production or sales, such as rent, salaries, and insurance premiums.
Q14: According to the permanent-income and life cycle
Q14: The average unemployment benefit of an American
Q20: Assume a production function is given
Q37: The home price index of housing prices
Q43: Given the unemployment rate data depicted in
Q59: New technology, oil price changes, pork-barrel spending,
Q74: Consider Figure 13.5. If the Fed sets
Q81: Consider Figure 13.5. If the Fed sets
Q90: Over the past 50 years or so:<br>A)
Q107: If the inflation rate is higher than