Figure 17.5: Investment-Output Ratio 2005-2012 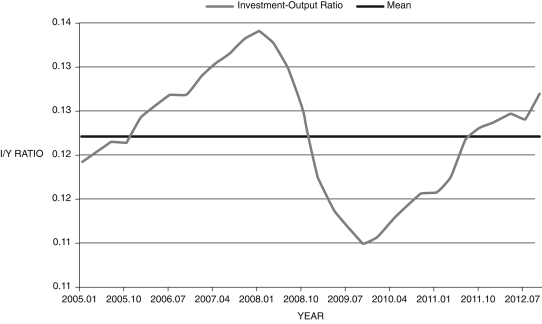
(Source: Federal Reserve Economic Data, St. Louis Federal Reserve)
-Figure 17.5 shows the quarterly investment-output ratio (It/Yt) for 2005-2012. Use the discussion on desired capital to investment, and what you know about the Great Recession, to motivate a discussion about the decline in investment that began in the mid-2000s.
Definitions:
Purchasing Products
The act of obtaining goods or services in exchange for money, critical in consumer behavior studies.
Scope And Complexity
Refers to the extent, range, and intricacies of a project's objectives, deliverables, and requirements.
Standardization And Specialization
A process that involves implementing uniform procedures and practices while focusing on specific areas of expertise to improve efficiency and quality.
Standard Deviation
A measure reflecting how much the data points diverge or spread out from each other.
Q3: Consider Figure 18.2. What was the cause
Q19: Professor John Taylor suggested using which
Q22: Use the aggregate supply/aggregate demand model in
Q28: Why does IKEA North America have a
Q39: The problem the household must solve is:<br>A)
Q41: When we discuss government expenditure, we are
Q71: Free labor migration is more effective at
Q80: Which of the following countries has negative
Q98: Which of the following is NOT household
Q109: The user cost of capital with