The graph below shows the supply and demand curves for dollars in the pound/dollar market. 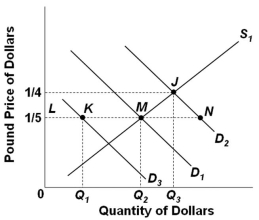 Refer to the graph above. Assume that D1 and S1 are the initial demand for and supply of dollars. Suppose that Britain's demand for dollars increases from D1 to D2. If the British government wishes to fix the exchange rate at the initial level, one possible way to do this is for the government to:
Definitions:
Heckscher-Ohlin Model
An economic theory that proposes countries export what they can most efficiently and abundantly produce.
Comparative Advantage
The ability of an individual, company, or country to produce a good or service at a lower opportunity cost than its competitors.
Ricardian Model
An economic theory that focuses on comparative advantage, explaining how countries can gain from trade by specializing in producing goods at a lower opportunity cost.
Production Possibility Frontiers
These are curves that depict the maximum potential output of a combination of two goods or services that an economy can produce with available resources.
Q22: The Trade Adjustment Assistance Act of 2002
Q22: <img src="https://d2lvgg3v3hfg70.cloudfront.net/TB4895/.jpg" alt=" Refer to the
Q49: What is one of the major shortcomings
Q76: China is very close to catching up
Q78: The vicious circle of poverty is based
Q84: Which of the following would be an
Q98: The following table contains hypothetical data for
Q126: The industrially advanced nations had an average
Q137: The United States, Germany, Japan, Britain, France,
Q145: Assume that a tariff is imposed on