Multiple Choice
The table below shows the quantity of labor (measured in hours) and the productivity of labor (measured in real GDP per hour) in a hypothetical economy in three different years. 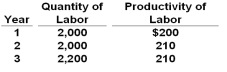 Refer to the above table. Between Year 2 and Year 3, real GDP increased by:
Definitions:
Related Questions
Q10: In order to achieve economic efficiency in
Q14: The following are national income account data
Q19: Historically, the total amount of real capital
Q21: (The following national income statistics are in
Q28: (The following national income data for an
Q48: The following factors tend to make the
Q53: The appeal to government for special benefits
Q79: The reasons why per capita GDP in
Q108: Increased labor productivity has been less important
Q121: Politicians seeking reelection tend to do the