Assume that the graphs show a competitive market for the product stated in the question. 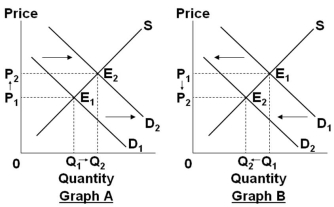
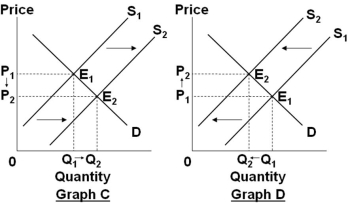 Select the graph above that best shows the change in the market specified in the following situation: In the market for wheat, when the cost of fertilizer decreases.
Definitions:
Manufacturing Overhead Cost
Indirect factory-related costs incurred when a product is manufactured, including the costs of utilities, maintenance, and property taxes.
Machine Hours
A measure of production output or activity based on the number of hours a machine operates.
Overhead Application Rate
A calculation used to allocate indirect costs to specific production activities or departments based on a predetermined formula.
Machine Hours
A measure of the amount of time a machine is used during a specified period, often used as a basis for allocating machine-related costs to products.
Q13: The government may not implement policies intended
Q33: At least in theory, Congress can regulate
Q58: In a market system, which of the
Q98: <img src="https://d2lvgg3v3hfg70.cloudfront.net/TB4895/.jpg" alt=" Refer to the
Q108: When economic efficiency is attained, it implies
Q113: <img src="https://d2lvgg3v3hfg70.cloudfront.net/TB4895/.jpg" alt=" Refer to the
Q128: <img src="https://d2lvgg3v3hfg70.cloudfront.net/TB4895/.jpg" alt=" Refer to the
Q142: If some activity creates external benefits as
Q175: If falling gasoline prices are good for
Q202: Assume that a consumer has a given