Multiple Choice
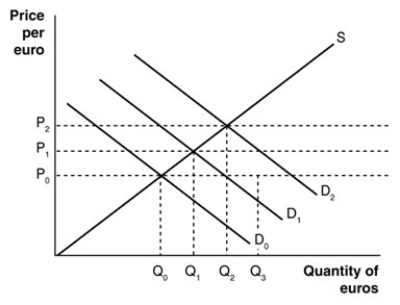
-In the above figure, which of the following is a possible explanation for the reduction in the equilibrium value of the European euro from P2 to P1?
Definitions:
Related Questions
Q12: An increase in the demand for the
Q20: Since the 1930s, overall tariff rates in
Q46: The marginal cost curve of a firm
Q143: To know whether a particular situation for
Q164: Refer to the above figure. S1 is
Q191: The effect of an import quota is<br>A)
Q228: If a country wants to keep its
Q231: Where pollution is concerned, if an automobile
Q273: The contention that specific sensitive domestic technologies
Q348: Because of scarcity, rationing is<br>A) unimportant because