Consider the following set of quarterly sales data given in thousands of dollars. 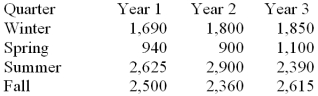
The following dummy variable model that incorporates a linear trend and constant seasonal variation was used: y (t)= B0 + B1t + BQ1(Q1)+ BQ2(Q2)+ BQ3(Q3)+ Et
In this model there are 3 binary seasonal variables (Q1,Q2,and Q3).
Where
Qi is a binary (0,1)variable defined as:
Qi = 1,if the time series data is associated with quarter i;
Qi = 0,if the time series data is not associated with quarter i.
The results associated with this data and model are given in the following MINITAB computer output.
The regression equation is
Sales = 2442 + 6.2 Time - 693 Q1 - 1499 Q2 + 153 Q3 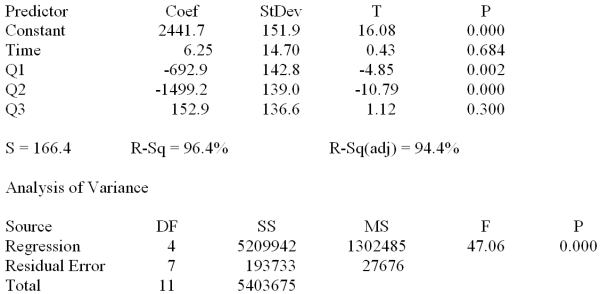
At = .05,test the significance of the model.
Definitions:
Credit Sales
Transactions where the goods or services are provided to a customer with an agreement that payment will be made at a later date.
EOQ
Economic Order Quantity is the ideal quantity of inventory a company should purchase to minimize the total costs of ordering and holding.
Quantity Discount
A pricing strategy where the price per unit of an item is reduced based on the quantity purchased, incentivizing larger orders.
Carrying Costs
The expenses incurred by holding inventory or assets over a period of time.
Q10: The management of a professional baseball
Q24: In a multiple regression model,a point
Q29: Assume that the following data set is
Q33: Consider the following partial computer output from
Q39: The demand for a product for the
Q50: Use the following information for the three
Q52: Given the following data <img src="https://d2lvgg3v3hfg70.cloudfront.net/TB1737/.jpg" alt="Given
Q63: For a given multiple regression model with
Q74: A control chart is a graph whose
Q96: Use this information about 10 shipments of