Consider the following partial computer output for a multiple regression model. 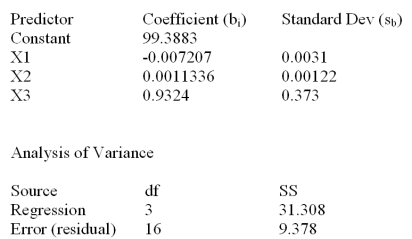 What is R2?
Definitions:
Simple Regression
A statistical method for quantifying the relationship between a single independent variable and a single dependent variable.
Intercept
In statistics and mathematics, the point at which a line crosses the y-axis in a graph, representing the value of the dependent variable when the independent variable is zero.
Error Term
The difference between observed values and estimated values in a statistical model.
Multicollinearity
A statistical phenomenon where two or more predictor variables in a multiple regression model are highly correlated, potentially distorting estimates.
Q8: Regression models that employ more than one
Q11: <img src="https://d2lvgg3v3hfg70.cloudfront.net/TB1737/.jpg" alt=" Use this equation
Q36: The actual counts in the cells of
Q50: If the limits of the confidence interval
Q68: Consider the 3X2 contingency table below. <img
Q68: Below is a partial multiple regression
Q71: A control chart on which subgroup ranges
Q89: Suppose you are a researcher investigating the
Q89: Which of the following residual plots is
Q90: Consider the following partial analysis of variance