Solved
Below Is a Partial Multiple Regression ANOVA Table = 01Calculate F and Make Your Decision About Whether the Model
Essay
Below is a partial multiple regression ANOVA table. 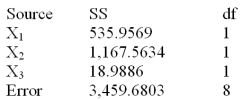
Test the overall usefulness of the model at = .01.Calculate F and make your decision about whether the model is useful for prediction purposes.
Definitions:
Related Questions
Q1: When testing H<sub>0</sub>: <span
Q2: Consider the following partial computer output for
Q23: An independent variable dropped during an iteration
Q30: Experimental data is collected so that the
Q43: A county has four major hospitals: 1)Regional
Q47: Assume that the current date is February
Q56: In comparing regression models,the regression model with
Q94: A goal of statistical process control is
Q107: Those fluctuations that are associated with climate,holidays
Q117: If we are testing the hypothesis about