The manufacturer of a light fixture believes that the dollars spent on advertising,the price of the fixture and the number of retail stores selling the fixture in a particular month,influence the light fixture sales.The manufacturer randomly selects 10 months and collects the following data: 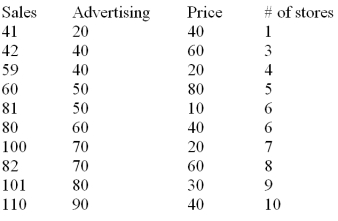 The sales are in thousands of units per month,the advertising is given in hundreds of dollars per month,and the price is the unit retail price for the particular month.Using MINITAB the following computer output is obtained.
The regression equation is
Sales = 31.0 + 0.820 Advertising - 0.325 Price + 1.84 Stores 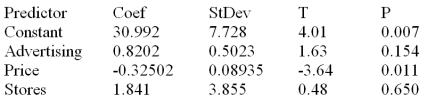 S = 5.465 R - Sq = 96.7% R - Sq(adj)= 95.0%
Analysis of Variance 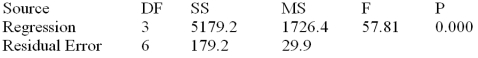 Based on the multiple regression model given above,the point estimate of the monthly light fixture sales corresponding to second sample data is 49.82 or 49,820 units.This point estimate is calculated based on the assumption that the company spends $4000 on advertising,the price of the fixture is $60 and the fixture is being sold at 3 retail stores.Additional information related to this point estimate is given below.
  Calculate the 95% prediction interval for this point estimate.
Definitions:
Disadvantages
The drawbacks or unfavorable aspects associated with a particular decision, action, or strategy.
P/E Ratios
Price-to-Earnings Ratio, a valuation measure comparing the current share price of a company to its per-share earnings, indicating the dollar amount an investor can expect to invest to receive one dollar of the company's earnings.
Valuation
The process of determining the present value of an asset or a company.
Comparing Firms
The analysis, often financial-based, used to compare the performance, efficiency, and health of different companies.
Q12: A cholesterol test was given to
Q12: Given the following data <img src="https://d2lvgg3v3hfg70.cloudfront.net/TB1737/.jpg" alt="Given
Q36: <img src="https://d2lvgg3v3hfg70.cloudfront.net/TB1737/.jpg" alt=" The Excel/Mega-Stat output
Q57: Consider the following partial analysis of variance
Q62: When testing H<sub>0</sub>: <span class="ql-formula"
Q66: In one-way ANOVA,other factors being equal,the further
Q83: Given the following data <img src="https://d2lvgg3v3hfg70.cloudfront.net/TB1737/.jpg" alt="Given
Q99: <img src="https://d2lvgg3v3hfg70.cloudfront.net/TB1737/.jpg" alt=" The Excel/Mega-Stat output
Q99: Exponential smoothing is a forecasting method that
Q100: Find an individual 95 percent confidence interval