The manufacturer of a light fixture believes that the dollars spent on advertising,the price of the fixture,and the number of retail stores selling the fixture in a particular month,influence the light fixture sales.The manufacturer randomly selects 10 months and collects the following data: 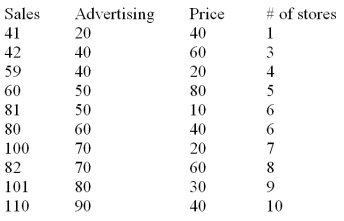 The sales are in thousands of units per month,the advertising is given in hundreds of dollars per month,and the price is the unit retail price for the particular month.Using MINITAB the following computer output is obtained.
The regression equation is
Sales = 31.0 + 0.820 Advertising - 0.325 Price + 1.84 Stores 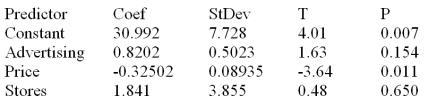 S = 5.465v R - Sq = 96.7% R - Sq(adj)= 95.0%
Analysis of Variance 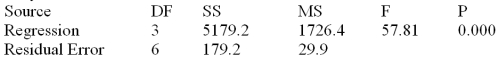 Based on the multiple regression model given above,the point estimate of the monthly light fixture sales corresponding to second sample data is 49.82 or 49,820 units.This point estimate is calculated based on the assumption that the company spends $4000 on advertising,the price of the fixture is $60 and the fixture is being sold at 3 retail stores.Additional information related to this point estimate is given below.
  The 95% prediction interval for the point estimate given above is from 33.9 to 65.74.Interpret the meaning of this interval.
Definitions:
Cost Reduction
The process or strategies aimed at decreasing the total expenses incurred by a business, thereby increasing its profitability.
Internet Business Models
Refers to the strategies and structures that businesses operating online use to generate revenue and sustain their operations.
Advertising-Based
Pertaining to a revenue model or content strategy that relies primarily on advertising for income generation.
Markup-Based
Referring to a pricing strategy where the selling price of a product is determined by adding a specific amount or percentage to its cost.
Q18: A t-test is used in testing the
Q33: In a regression model,at any given combination
Q53: The variance inflation factor measures the relationship
Q53: A readability analysis is conducted to determine
Q55: An experiment was performed on a certain
Q69: The trials of a multinomial probability are
Q76: Consider the following data: <img src="https://d2lvgg3v3hfg70.cloudfront.net/TB1737/.jpg"
Q78: _ component of time series refers to
Q109: When testing a hypothesis about the mean
Q124: The Laspeyres index and the Paasche index