Refer to the information provided in Table 7.3 below to answer the questions that follow.
Table 7.3
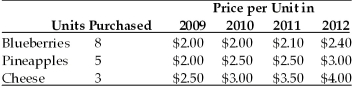
-Refer to Table 7.3.Suppose 2010 is the base year.The price index in 2010 is
Definitions:
Slope
In mathematics, the rate at which a line inclines or declines, indicating the steepness of the line.
Regression Line
A straight line that describes how a response variable Y changes as an explanatory variable X changes, used in linear regression.
Least Squares Regression Line
A straight line that minimizes the sum of the squared differences between the observed values and the values predicted by the line.
Estimated Value
An approximation of a quantity based on available information or statistical methods.
Q27: In figure 4.6 at equilibrium,consumer surplus is
Q67: The period in the business cycle from
Q71: The demand for massage therapists declined in
Q77: Which of the following is NOT a
Q106: If the labor force is 500 and
Q116: If net investment in 2012 is $350
Q156: When taxes depend on income,a higher tax
Q157: If the government spending multiplier is 10,then
Q164: Refer to Figure 8.1.This household's consumption function
Q175: Suppose consumption is $60,000 when income is