Multiple Choice
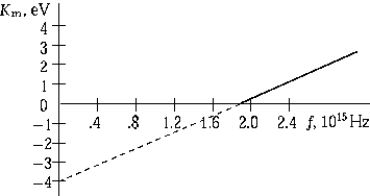 The graph shows the maximum kinetic energy of electrons emitted by a photosensitive surface as a function of the frequency of the incident radiation. The slope of this curve represents
Definitions:
Related Questions
Q14: The expression relating the bending of the
Q22: Spaceship Solange passes spaceship Hari with a
Q28: <img src="https://d2lvgg3v3hfg70.cloudfront.net/TB6081/.jpg" alt=" A
Q52: An electromagnetic wave is propagating in the
Q54: The classical microscopic model of electric conduction<br>A)
Q76: An earthbound radar monitors a spaceship moving
Q81: You will never find an electron in
Q97: The yellow line of a Sodium
Q100: <img src="https://d2lvgg3v3hfg70.cloudfront.net/TB6081/.jpg" alt=" A ray of
Q139: An object is placed to the left