In the graph below, which of the following represents (1) the curve that describes the changes in ratio of nuclear volume to cytoplasmic volume during the cleavage stage of development; and (2) the correct statement about the changes in size of the blastomeres during that stage? 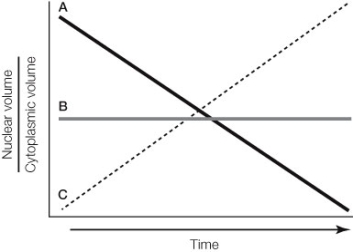
Definitions:
Q1: Immunological tolerance<br>A) depends on exposure to an
Q2: The most photosensitive area of the retina
Q23: At birth, a female has about one
Q25: Human males have muscles in the scrotum
Q37: Which of the following ions is most
Q54: Which statement about trophoblast cells is true?<br>A)
Q59: When people fail to get adequate amounts
Q70: Which of the following statements about neural
Q97: Which of the following behaviors results from
Q129: Which of the following statements is true?<br>A)