Alternatives 1 and 2 in the following payoff table represent the two possible manufacturing strategies that the EKA manufacturing company can adopt.The level of demand affects the success of both strategies.The states of nature (SI)represent the levels of demand for the company products.S1,S2,and S3 characterize high,medium,and low demand,respectively.The payoff values are in thousands of dollars. 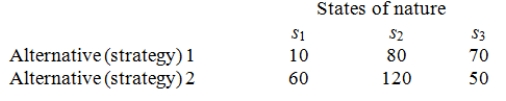 The management believes that weather conditions significantly affect the level of demand.48 monthly sales reports are randomly selected.These monthly sales reports show 15 months with high demand,28 months with medium demand,and 5 months with low demand.12 of the 15 months with high demand had favorable weather conditions.14 of the 28 months with medium demand had favorable weather conditions.Only 1 of the 5 months with low demand had favorable weather conditions.Based on this information,the prior probabilities have been revised.If the weather conditions are favorable,P(S1)= .4286,P(S2)= .5357,and P(S3)= .0357;and if the weather conditions are poor,P(S1)= .1364,P(S2)= .6818,and P(S3)= .1818.It is also determined that the probability of favorable weather is 0.56 and the probability of poor weather is 0.44.Determine the expected value of sample information.What is the maximum amount that the company is willing to pay for the weather information and the additional analysis?
Definitions:
Average Total Cost
The total cost of production divided by the number of units produced, representing the average cost per unit of output.
Average Variable Cost
The total variable costs (costs that change with production volume) divided by the quantity of output produced.
Average Total Cost
The sum of all production costs divided by the quantity of output produced, representing the per-unit cost.
Marginal Cost
Marginal cost refers to the increase or decrease in the total cost when the quantity produced is incremented by one unit.
Q11: Which of the following is not a
Q14: Consider the following partial computer output from
Q15: A simple linear regression model is an
Q15: In utility analysis,a utility curve that shows
Q32: The no-trend time series model is given
Q43: Control charts are used to reduce common
Q44: Backward elimination regression is an automatic model-building
Q66: The expected value criterion is used for
Q72: When we assess the worth of sample
Q97: A sequence of values of some variable