Consider the following set of quarterly sales data,given in thousands of dollars. 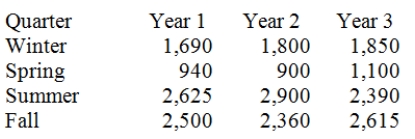 The following dummy variable model that incorporates a linear trend and constant seasonal variation was used: y(t)= B0 + B1t + BQ1(Q1)+ BQ2(Q2)+ BQ3(Q3)+ Et.In this model,there are 3 binary seasonal variables (Q1,Q2,and Q3),where Qi is a binary (0,1)variable defined as:
Qi = 1,if the time series data is associated with quarter i;
Qi = 0,if the time series data is not associated with quarter i.The results associated with this data and model are given in the following Minitab computer output.The regression equation is
Sales = 2442 + 6.2Time − 693Q1 − 1499Q2 + 153Q3 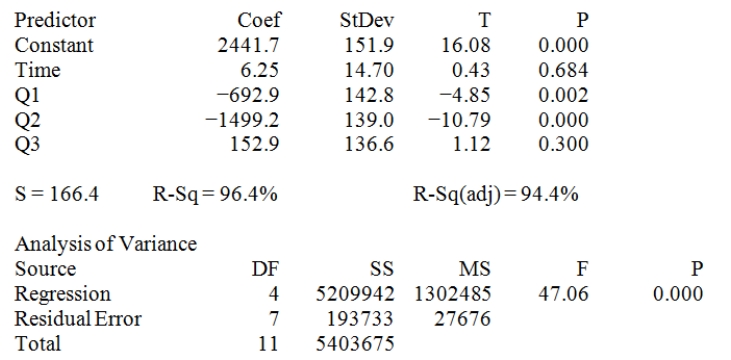 Provide a managerial interpretation of the regression coefficients for the variables Q1 (quarter 1),Q2 (quarter 2),and Q3 (quarter 3).
Definitions:
Primary Data
Data collected firsthand for a specific research purpose, involving direct interaction with the study subjects through surveys, interviews, or experiments.
Time-Consuming
Requiring a significant amount of time to complete, often more than what is considered desirable or efficient.
Costly
Involving great expense; something that requires a high amount of money or resources.
Specific Firm
Refers to a particular company or business entity mentioned or focused upon in a discussion.
Q1: Regression analysis. <img src="https://d2lvgg3v3hfg70.cloudfront.net/TB2569/.jpg" alt="Regression analysis.
Q2: In testing the difference between the means
Q11: AAA Co.operates distribution centers in the Midwest.Three
Q29: In order to test the effectiveness of
Q43: A Paasche index more accurately provides a
Q49: In comparing the difference between two independent
Q49: Which one of the following nonparametric methods
Q70: We are testing H<sub>0</sub>: p ≥ .7;versus
Q72: A local tire dealer wants to predict
Q73: In general,the number of dummy variables used