Consider the following table.It provides the price and quantity data for three brands of a good. 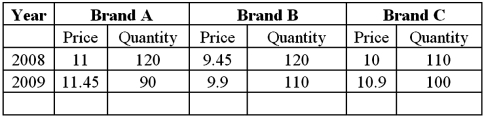
a.Compute the weighted aggregate price index using the Laspeyres method with 2008 as the base year.
B)Compute the weighted aggregate price index using the Paasche method with 2008 as the base year.
C)Suppose the new price and quantity data was available for the base year of 2000 instead of 2008.Would this lead to a substantial difference between the two indices? Explain your answer.
Definitions:
Output
The total amount of goods or services produced by a company, sector, or economy.
Energy Input
Refers to the energy required to produce goods and services, including electricity, fossil fuels, and renewable sources.
Per Capita Energy Use
The average amount of energy consumed per person in a given area or country.
Developed Countries
Nations with a high level of economic development, typically characterized by a high gross domestic product (GDP) per capita.
Q2: A study was conducted to determine if
Q4: By the late 1920s,African Americans were kept
Q27: The quadratic and logarithmic models,y = β<sub>0</sub>
Q28: The combined impact of women's gender,race,class,age,and sexual
Q31: Exhibit 17.9.A bank manager is interested in
Q33: Class is found in which of the
Q41: Exhibit 18.2.The following table includes the information
Q44: When some explanatory variables of a regression
Q67: The price of a basket of goods
Q93: In the regression equation <img src="https://d2lvgg3v3hfg70.cloudfront.net/TB2339/.jpg" alt="In