Essay
The following table provides the price and quantity data for three brands of a particular good during 2010 and 2011. 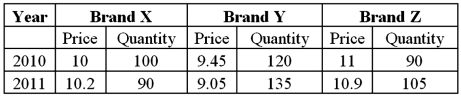
a.Use 2010 as the base year and compute the weighted aggregate price index for 2011 using the Laspeyres method.
B)Interpret the result.
Definitions:
Related Questions
Q1: Exhibit 15-7.A manager at a local bank
Q2: In the United States,only this group has
Q4: It has been argued that while core
Q5: Given the data on y and x,what
Q11: How have expectations of motherhood and work
Q12: An example of individual racism is<br>A)racism that
Q20: Which of the following is a criticism
Q24: How are poor students disadvantaged by their
Q27: The variance of the rates of return
Q34: Exhibit 20.11.A wine magazine wants to know