Exhibit 18.8.Quarterly sales of a department store for the last 7 years are given in the following table. 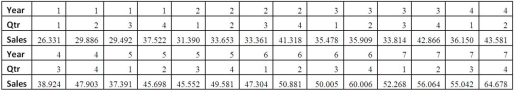
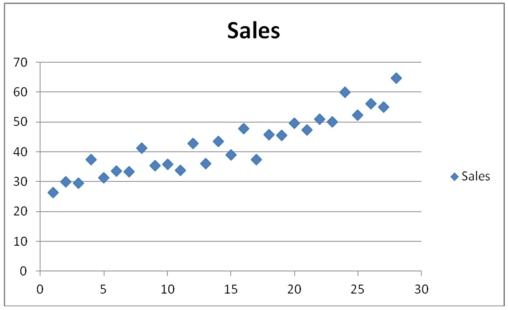 The Excel scatterplot shown above indicates that the quarterly sales have an increasing trend and seasonality.Therefore,the linear regression model,Sales = β0 + β1Qtr1 + β2Qtr2 + β3Qtr3 + β4t + ε with three seasonal dummy variables Qtr1,Qtr2 and Qtr3,and the decomposition method are proposed to make sales forecasts.For the regression model,the following Excel partial output is available.
 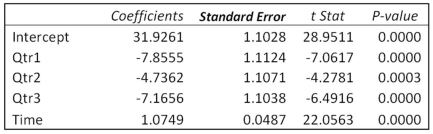 Refer to Exhibit 18.8.Using the regression equation for the linear trend model with seasonal dummy variables,what is the sales forecast for the first quarter of Year 8?
Definitions:
Job Analysis
The process of gathering, documenting, and analyzing information about job tasks, responsibilities, and the required skills, knowledge, and abilities for a specific role.
Midpoint Method
A technique for calculating the percent change in which changes in a variable are compared with the average, or midpoint, of the starting and final values.
Price Elasticity
A measure of how much the quantity demanded of a good responds to a change in the price of that good, reflecting the sensitivity of consumers to price changes.
Quantity Demanded
The total amount of a good or service that consumers are willing and able to purchase at a specific price level, at a given time.
Q6: Government efforts to deal with the poor
Q8: Explain how poverty is measured and how
Q16: Under President Theodore Roosevelt's jobs program<br>A)almost 28
Q19: Exhibit 16.6.Thirty employed single individuals were randomly
Q38: While we use the mean square error
Q49: A sociologist estimates the following regression relating
Q60: Since both the Laspeyres and Paasche indices
Q62: Exhibit 16-7.It is believed that the sales
Q63: Exhibit 16-4.The following data shows the cooling
Q81: Consider the following simple linear regression model: