Exhibit 18.8.Quarterly sales of a department store for the last 7 years are given in the following table. 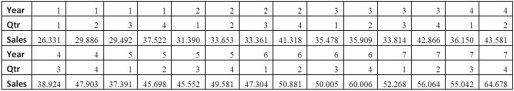
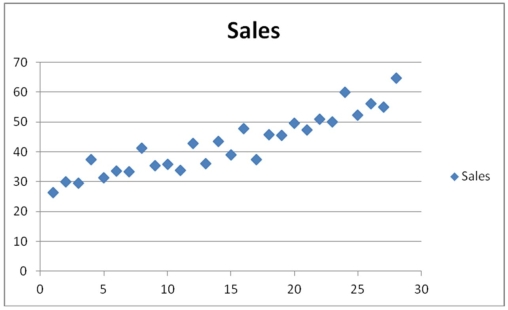 The Excel scatterplot shown above indicates that the quarterly sales have an increasing trend and seasonality.Therefore,the linear regression model,Sales = β0 + β1Qtr1 + β2Qtr2 + β3Qtr3 + β4t + ε with three seasonal dummy variables Qtr1,Qtr2 and Qtr3,and the decomposition method are proposed to make sales forecasts.For the regression model,the following Excel partial output is available.
 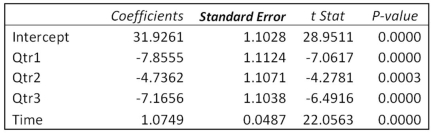 Refer to Exhibit 18.8.Using the regression equation for the linear trend model with seasonal dummy variables,what is the sales forecast for the fourth quarter of Year 8?
Definitions:
Benefits And Costs
The positive outcomes (benefits) and negative outcomes (costs) associated with a particular action or investment, often analyzed in decision-making.
Weak Property Rights
Situations where ownership rights are not fully enforced, leading to potential misuse or underinvestment in resources.
Faster Extraction
The increased rate at which natural resources are removed from the environment, often aiming to meet high demand but potentially leading to sustainability issues.
Long-term Stream
A sustained flow or sequence of activities, processes, or outputs extending over a lengthy period.
Q1: Job restructuring through job sharing can help
Q12: The ecology of class refers to the
Q16: The index of occupational segregation<br>A)is a directory
Q29: Exhibit 13.2 A researcher with Ministry of
Q61: A Paasche index with updated weights:<br>A)is likely
Q72: The capital asset pricing model is given
Q80: In the decomposition method,which of the following
Q86: Exhibit 15-8.A real estate analyst believes that
Q97: Exhibit 19-1.Joanna Robertson bought a share of
Q99: Exhibit 18.6.Based on quarterly data collected over