Exhibit 18.8.Quarterly sales of a department store for the last 7 years are given in the following table. 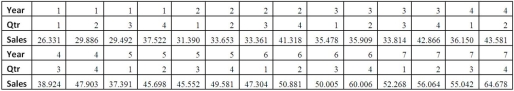
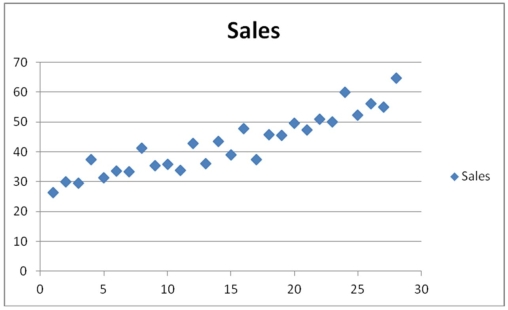 The Excel scatterplot shown above indicates that the quarterly sales have an increasing trend and seasonality.Therefore,the linear regression model,Sales = β0 + β1Qtr1 + β2Qtr2 + β3Qtr3 + β4t + ε with three seasonal dummy variables Qtr1,Qtr2 and Qtr3,and the decomposition method are proposed to make sales forecasts.For the regression model,the following Excel partial output is available.
 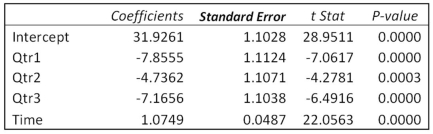 Refer to Exhibit 18.8.(Use Excel or statistical software. )Using the decomposition method,
A)compute the adjusted seasonal indices for the four quarters.
B)find the linear trend equation for the seasonally adjusted quarterly sales.
C)make the sales forecasts for the first and fourth quarter of Year 8.
Definitions:
Cognitive System
A system of mental processes that includes perception, memory, judgment, and reasoning, responsible for thought and learning.
Evolutionary Forces
Processes such as natural selection, genetic drift, mutation, and gene flow that contribute to the changes in the genetic composition of populations over time.
Structuralism
A theoretical paradigm in anthropology and sociology that posits elements of human culture must be understood in terms of their relationship to a broader system or structure.
Q9: Consider the following regression results based on
Q25: Which of the following is an estimated
Q27: Public schools in the U.S.are funded by<br>A)the
Q35: A sociologist studies the relationship between a
Q58: An investment analyst wants to examine the
Q63: Exhibit 14-6.A manager at a local bank
Q84: Causal forecasting models are based on regression
Q86: The curve representing the regression equation <img
Q88: Exhibit 17.2.To examine the differences between salaries
Q95: Exhibit 15-8.A real estate analyst believes that