Exhibit 18.7.The following table shows the annual revenues (in millions of dollars)of a pharmaceutical company over the period 1990-2011. 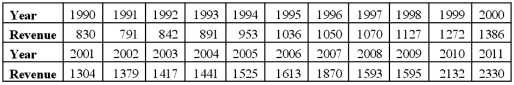 The autoregressive models of order 1 and 2,
 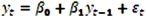 and
and  ,were applied on the time series to make revenue forecasts.The relevant parts of Excel regression outputs are given below.
Model AR(1): 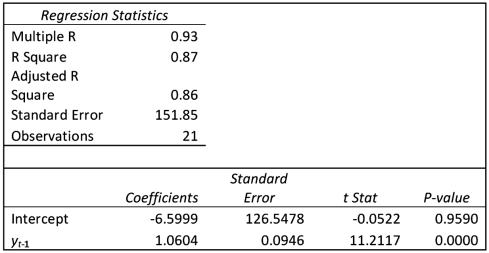 Model AR(2):
 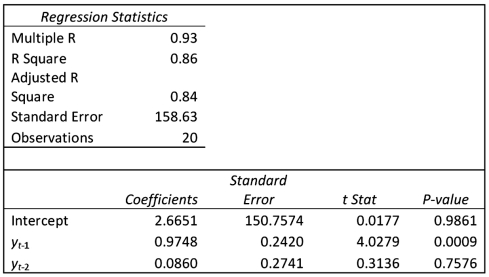 Refer to Exhibit 18.7.(Use Regression in Data Analysis of Excel. )Compare the autoregressive models,
  and
and  ,through the use of MSE and MAD.Hint.You may compute the errors by clicking "Residuals";to analyze
  instead of
  ,it suffices to click "Constant is Zero".
Definitions:
Complexity Of Reality
The notion that real-world situations are intricate due to interconnections and interdependencies among various elements and variables.
Simplifications
The process of making something easier to understand or do by reducing its complexity.
Trade-Offs
Decisions made that involve a sacrifice of one thing to obtain another, often used in discussions of economic and personal choices.
Opportunity Cost
This represents the value of the best alternative foregone when a decision to pursue a certain action is made.
Q1: One-way ANOVA analyzes the effect of one
Q6: The Taft-Hartley Act passed by Congress in
Q17: Exhibit 18.8.Quarterly sales of a department store
Q19: When it comes to the undeserving poor,the
Q22: What are the two middle classes?
Q63: Exhibit 20.2.A trading magazine wants to determine
Q66: Rita Jacob purchased a corporate bond at
Q96: Exhibit 17.2.To examine the differences between salaries
Q96: Consider the following regression results based on
Q106: The coefficient of determination R<sup>2</sup> is _.<br>A)sometimes