Exhibit 17.9.A bank manager is interested in assigning a rating to the holders of credit cards issued by her bank.The rating is based on the probability of defaulting on credit cards and is as follows. 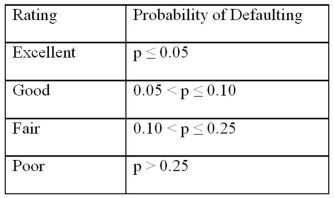 To estimate this probability,she decided to use the logistic model:
 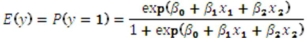 ,
,
where,
y = a binary response variable with value 1 corresponding to a default,and 0 to a no default,
x1 = the ratio of the credit card balance to the credit card limit (in percent),
x2 = the ratio of the total debt to the annual income (in percent).
Using Minitab on the sample data,she arrived at the following estimates: 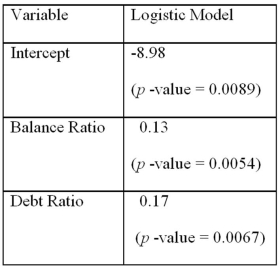 Note: The p-values of the corresponding tests are shown in parentheses below the estimated coefficients.
(Using Excel)Refer to Exhibit 17.9.Suppose that only applicants with excellent and good ratings are qualified for a loan.Assume that the balance ratio,x1,of those who apply is normally distributed with μ1 = 18% and σ2 = 6%,while their debt ratio,x2,is normally distributed with μ2 = 30% and σ2 = 8%.Because of limited capabilities of Excel,assume also that x1 and x2 are independent.Using Random Number Generator in Data Analysis of Excel,simulate 1000 applications to estimate the percent of those that are qualified for a loan.
Definitions:
Optic Nerve
The nerve that carries visual information from each retina to both sides of the brain.
Ganglion Cells
Specialized neurons located in the retina that play a critical role in processing visual information.
Axons
Long, slender projections of nerve cells that conduct electrical impulses away from the neuron's cell body, facilitating communication between neurons.
Bundles
Collections or groups of items or services packaged together.
Q6: Exhibit 15-1.An marketing analyst wants to examine
Q24: The standard error of the estimate measures<br>A)the
Q25: Exhibit 18.1.The past monthly demands are shown
Q25: Exhibit 14-10.A sociologist examines the relationship between
Q31: Exhibit 18.5.Based on quarterly data collected over
Q41: The major advantage of a logistic model
Q60: Exhibit 20.2.A trading magazine wants to determine
Q67: Exhibit 14-9.When estimating <img src="https://d2lvgg3v3hfg70.cloudfront.net/TB2339/.jpg" alt="Exhibit 14-9.When
Q78: Exhibit 13.6 A researcher wants to understand
Q106: Exhibit 17.8.A realtor wants to predict and