Exhibit 16-1.The following Excel scatterplot with the fitted quadratic regression equation illustrates the observed relationship between productivity and the number of hired workers. 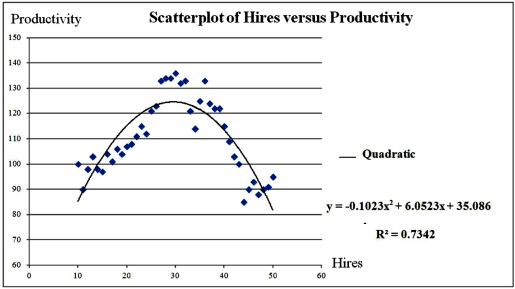 Refer to Exhibit 16.1.The quadratic regression equation found is:
Definitions:
Q1: Exhibit 15-7.A manager at a local bank
Q4: These types of schools have been very
Q17: Exhibit 18.8.Quarterly sales of a department store
Q19: Consider the following information regarding the price
Q22: The Wilcoxon signed-rank test for a population
Q23: Exhibit 13.6 A researcher wants to understand
Q43: For a multinomial experiment,which of the following
Q44: Which of the following identifies the range
Q51: Parametric tests typically assume the underlying population
Q67: Exhibit 14-9.When estimating <img src="https://d2lvgg3v3hfg70.cloudfront.net/TB2339/.jpg" alt="Exhibit 14-9.When