Exhibit 13.9 Psychology students want to determine if there are differences between the ability of business majors and science majors to solve various types of analytic problems.They conduct an experiment and record the amount of time it takes to complete each analytic problem.The following two-way ANOVA table summarizes their findings. 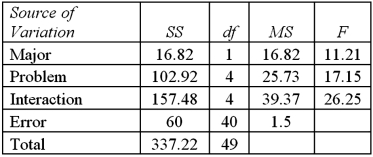 Refer to Exhibit 13.9.The number of different analytic problems the students solved is:
Definitions:
Earned Revenues
Income a company has generated for goods delivered or services provided, recognized when earned, not necessarily when received.
Incurred Expenses
Expenses that have been recognized in the accounting period when they are incurred, regardless of when the payment is made.
Profit Margin
A financial metric that shows the percentage of a company's revenue that remains as profit after accounting for costs and expenses.
Net Income
The remaining earnings of a company following the deduction of all expenses and taxes from its total revenues.
Q2: Exhibit 16-4.The following data shows the cooling
Q6: Exhibit 10.11.The student senate at a local
Q9: A regional sales manager of a bank
Q33: Exhibit 9-5.A university interested in tracking their
Q48: The model y = β<sub>0</sub> + β<sub>1</sub>x
Q82: The R<sup>2</sup> of a multiple regression of
Q87: Like the z distribution,the t distribution is
Q91: Exhibit 10.4.A 7000-seat theater is interested in
Q97: Exhibit 15-8.A real estate analyst believes that
Q102: Consider the following sample data: <img src="https://d2lvgg3v3hfg70.cloudfront.net/TB2339/.jpg"