Exhibit 12.7 The heights (in cm) for a random sample of 60 males were measured.The sample mean is 166.55,the standard deviation is 12.57,the sample kurtosis is 0.12,and the sample skewness is -0.23.The following table shows the heights subdivided into non-overlapping intervals. 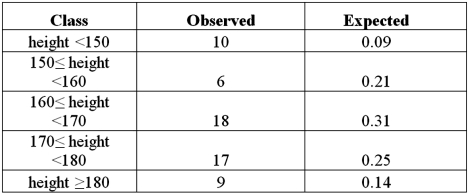 Refer to Exhibit 12.7.Suppose the value of the test statistic is 7.71.Using the critical value approach,decision and conclusion are:
Definitions:
Varying Times
Different or changing durations or moments at which something occurs or is scheduled to occur.
Short Segments
Brief parts or divisions of a piece of writing, presentation, or broadcast.
Analog
Pertaining to a device or system in which information is represented by continuously variable physical quantities, as opposed to digital representation.
Digital Technologies
Electronic tools, systems, devices, and resources that generate, store, or process data, such as computers, smartphones, and software.
Q3: A statistics instructor wants to examine the
Q6: The log-log and exponential models,ln(y)= β<sub>0</sub> +
Q6: Exhibit 12.8 The heights (in cm)for a
Q8: What is the most typical form of
Q51: Over the entire six years that students
Q60: Which of the following characteristics is true
Q62: Exhibit 13.5 A police chief wants to
Q82: Exhibit 9-1.A university is interested in promoting
Q90: Exhibit 16.2.Typically,the sales volume declines with an
Q105: A sample of 30 observations provides the