The following table shows the observed frequencies of the amount of assets under management for a sample of 134 hedge funds.The table also contains the hypothesized proportion of each class assuming the amount of assets under management has a normal distribution.The sample mean and standard deviation are 15 billion and 11 billion respectively. 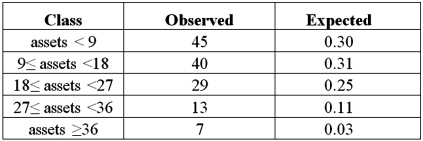
A)Set up the competing hypotheses for the goodness-of-fit test of normality for amount of assets under management.
B)Calculate the value of the test statistic and determine the degrees of freedom.
C)Specify the critical value at the 5% significance level.
D)Is there evidence to suggest the amount of assets under management do not have a normal distribution?
E)Are there any conditions which may not be satisfied?
Definitions:
Dow Jones
An index that shows how 30 large, publicly-owned companies based in the United States have traded during a standard trading session in the stock market.
Long-Term Growth
Refers to the sustained increase in the productive capacity of an economy over a significant period of time, typically years or decades.
Recessionary Period
A time characterized by economic decline across the economy, lasting more than a few months, typically visible in real GDP, real income, employment, industrial production, and wholesale-retail sales.
Inflation
A general increase in prices and fall in the purchasing value of money.
Q6: Under the assumption that the null hypothesis
Q16: Exhibit 9-3.The Boston public school district has
Q21: Exhibit 15-1.An marketing analyst wants to examine
Q38: When conducting a hypothesis test,which of the
Q58: Exhibit 12.2 A university has six colleges
Q68: The following table shows the heights (in
Q77: Exhibit 9-2.The owner of a large car
Q80: If the interaction between two factors is
Q101: Weather forecasters would like to report on
Q115: Exhibit 15-8.A real estate analyst believes that