Multiple Choice
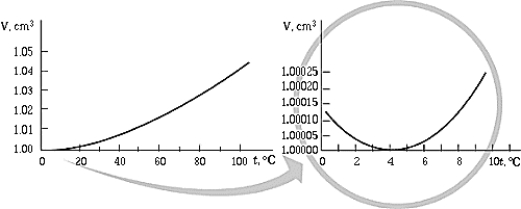 The graph shows the volume occupied by 1 g of water as a function of temperature. The graph shows that
Definitions:
Related Questions
Q7: A tertiary carbon atom is present in
Q12: What is the major product for the
Q28: Of the following compounds,the one with the
Q28: One mole of an ideal gas undergoes
Q30: A certain blackbody radiates 100 W at
Q43: Electromagnetic waves<br>A) include light, radio waves,
Q45: What is the major product of the
Q58: An electric power plant generates 100 MW
Q85: A container contains a 200 mL of
Q88: In which structure(s)below does nitrogen have a