The shaded block in the table below shows the amount of output that can be produced using different combinations of labor and capital in a hypothetical economy with a given type of technology.For example,1,200 units of output are produced when 75 units of labor and 75 units of capital are combined.This table is an example of a production function. 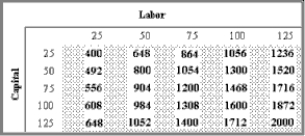 (A)Hold capital constant at 50 while you increase labor.What happens to output?
(B)Now hold labor constant at 50 and raise the level of capital.What happens to output?
(C)Finally,what happens to output when labor and capital are raised by the same amount,assuming that you start with 50 units of each?
(D)Sketch the production function on a graph that plots labor on the horizontal axis and output on the vertical axis.Assume capital is fixed at 50.What happens to the graph if capital is increased to 100?
(E)What happens to the output numbers in the table if there is an improvement in technology? What would happen to your graph in part (D)?
Definitions:
Biology
The scientific study of life and living organisms, including their structure, function, growth, evolution, distribution, and taxonomy.
Loneliness
A complex and usually unpleasant emotional response to isolation or lack of companionship, which can affect mental and physical health.
Personal Needs
Basic or individual requirements necessary for maintaining physical and emotional well-being.
Quality of Relationships
The degree of satisfaction, emotional connection, and positive dynamics shared between individuals in a relationship.
Q4: During the post-World War II period,both the
Q13: The role of government in tradable permit
Q13: To determine the long-run interest rate,you can
Q34: For the U.S.economy,the long-term economic effects of
Q38: In the base year,nominal and real GDP
Q95: Residential housing is considered physical capital only
Q120: The natural unemployment rate is another name
Q144: Another name for potential GDP is<br>A)GDP.<br>B)real GDP
Q152: The nongovernment share of GDP equals<br>A)saving as
Q173: When the government uses a subsidy in